Geocoding
Overview of Geocoders
Geocoding, i.e. converting addresses into coordinates or vice versa, is a really common GIS task. Luckily, in Python there are nice libraries that makes the geocoding really easy. One of the libraries that can do the geocoding for us is geopy that makes it easy to locate the coordinates of addresses, cities, countries, and landmarks across the globe using third-party geocoders and other data sources.
As said, Geopy uses third-party geocoders - i.e. services that does the geocoding - to locate the addresses and it works with multiple different service providers such as:
- ESRI ArcGIS
- Baidu Maps
- Bing
- geocoder.us
- GeocodeFarm
- GeoNames
- Google Geocoding API (V3)
- IGN France
- Mapquest
- Mapzen Search
- NaviData
- OpenCage
- OpenMapQuest
- Open Street Map Nominatim
- SmartyStreets
- What3words
- Yandex
Thus, there are plenty of geocoders where to choose from! However, for most of these services you might need to request so called API access-keys from the service provider to be able to use the service.
Luckily, Nominatim, which is a geocoder based on OpenStreetMap data does not require a API key to use their service if it is used for small scale geocoding jobs as the service is rate-limited to 1 request per second (3600 / hour). As we are only making a small set of queries, we can do the geocoding by using Nominatim.
Note
- Note 1: If you need to do larger scale geocoding jobs, use and request an API key to some of the geocoders listed above.
- Note 2: There are also other Python modules in addition to geopy that can do geocoding such as Geocoder.
Hint
You can get your access keys to e.g. Google Geocoding API from Google APIs console by creating a Project and enabling a that API from Library. Read a short introduction about using Google API Console from here.
Geocoding in Geopandas
It is possible to do geocoding in Geopandas using its integrated
functionalities of geopy. Geopandas has a function called geocode()
that can geocode a list of addresses (strings) and return a GeoDataFrame
containing the resulting point objects in geometry column. Nice,
isn’t it! Let’s try this out.
Download a text file called addresses.txt that contains few addresses around Helsinki Region. The first rows of the data looks like following:
id;addr
1000;Itämerenkatu 14, 00101 Helsinki, Finland
1001;Kampinkuja 1, 00100 Helsinki, Finland
1002;Kaivokatu 8, 00101 Helsinki, Finland
1003;Hermannin rantatie 1, 00580 Helsinki, Finland
We have an id for each row and an address on column addr.
- Let’s first read the data into a Pandas DataFrame using
read_csv()-function:
# Import necessary modules
import pandas as pd
import geopandas as gpd
from shapely.geometry import Point

# Filepath
fp = r"addresses.txt"

# Read the data
data = pd.read_csv(fp, sep=';')
# Let's take a look of the data
In [1]: data.head()
Out[1]:
     id                                           addr
0  1000       Itämerenkatu 14, 00101 Helsinki, Finland
1  1001          Kampinkuja 1, 00100 Helsinki, Finland
2  1002           Kaivokatu 8, 00101 Helsinki, Finland
3  1003  Hermannin rantatie 1, 00580 Helsinki, Finland
4  1005     Tyynenmerenkatu 9, 00220 Helsinki, Finland
Now we have our data in a Pandas DataFrame and we can geocode our addresses.
- Let’s
# Import the geocoding tool
In [2]: from geopandas.tools import geocode

# Geocode addresses with Nominatim backend
In [3]: geo = geocode(data['addr'], provider='nominatim')

In [4]: geo.head(2)
Out[4]:
                                             address  \
0  Ruoholahti, 14, Itämerenkatu, Ruoholahti, Läns...
1  Kamppi, 1, Kampinkuja, Kamppi, Eteläinen suurp...

                        geometry
0  POINT (24.9155655 60.1632005)
1  POINT (24.9316914 60.1690222)
And Voilà! As a result we have a GeoDataFrame that contains our original
address and a ‘geometry’ column containing Shapely Point -objects that
we can use for exporting the addresses to a Shapefile for example.
However, the id column is not there. Thus, we need to join the
information from data into our new GeoDataFrame geo, thus making
a Table Join.
Hint
Nominatim works relatively nicely if you have well defined and well-known addresses such as the ones that we used in this tutorial. However, in some cases, you might not have such well-defined addresses, and you might have e.g. only the name of a museum available. In such cases, Nominatim might not provide such good results, and in such cases you might want to use e.g. Google Geocoding API (V3). Take a look from previous materials, where we show how to use Google Geocoding API in a similar manner as we used Nominatim here.
Table join
Table joins are really common procedures when
doing GIS analyses. As you might remember from our earlier lessons, combining data from different tables based on common
key attribute can be done easily in Pandas/Geopandas using .merge()
-function.
However, sometimes it is useful to join two tables together based on the index of those DataFrames. In such case, we assume
that there is same number of records in our DataFrames and that the order of the records should be the same in both DataFrames.
In fact, now we have such a situation as we are geocoding our addresses where the order of the geocoded addresses in geo DataFrame is the same
as in our original data DataFrame.
Hence, we can join those tables together with join() -function which merges the two DataFrames together
based on index by default.
In [5]: join = geo.join(data)

In [6]: join.head()
Out[6]:
                                             address  \
0  Ruoholahti, 14, Itämerenkatu, Ruoholahti, Läns...
1  Kamppi, 1, Kampinkuja, Kamppi, Eteläinen suurp...
2  Citycenter, 8, Kaivokatu, Keskusta, Kluuvi, Et...
3  Hermannin rantatie, Kyläsaari, Hermanni, Helsi...
4  Hesburger Jätkäsaari, 9, Tyynenmerenkatu, Jätk...

                             geometry    id  \
0       POINT (24.9155655 60.1632005)  1000
1       POINT (24.9316914 60.1690222)  1001
2  POINT (24.94244049213 60.16988445)  1002
3       POINT (24.9709473 60.1975589)  1003
4       POINT (24.9215601 60.1566956)  1005

                                            addr
0       Itämerenkatu 14, 00101 Helsinki, Finland
1          Kampinkuja 1, 00100 Helsinki, Finland
2           Kaivokatu 8, 00101 Helsinki, Finland
3  Hermannin rantatie 1, 00580 Helsinki, Finland
4     Tyynenmerenkatu 9, 00220 Helsinki, Finland
- Let’s also check the data type of our new
jointable.
In [7]: type(join)
Out[7]: geopandas.geodataframe.GeoDataFrame
As a result we have a new GeoDataFrame called join where we now have
all original columns plus a new column for geometry.
- Now it is easy to save our address points into a Shapefile
# Output file path
outfp = r"/home/geo/addresses.shp"

# Save to Shapefile
join.to_file(outfp)
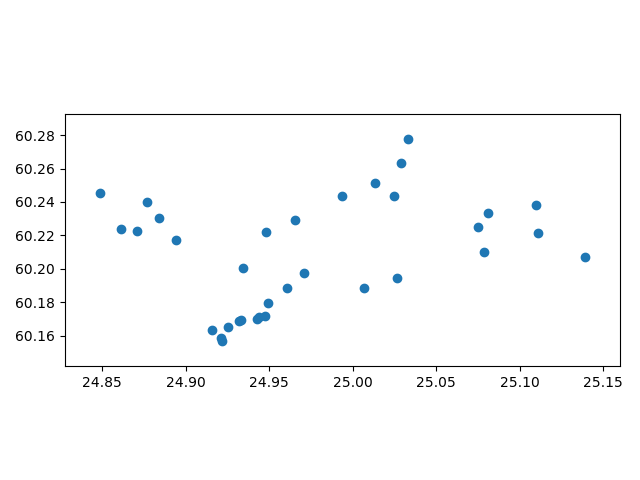
That’s it. Now we have successfully geocoded those addresses into Points and made a Shapefile out of them. Easy isn’t it! Let’s still take a look how our data looks like.
In [8]: join.plot()
Out[8]: <matplotlib.axes._subplots.AxesSubplot at 0x20c8fb0e080>

In [9]: plt.tight_layout();
Hint
Quite often you want to join two GIS-layers together based on a common field that is found on both layers.
Conducting such table join is really easy with merge() function. You can take a look of an example of conducting
such from here.