Working environment
During this course we will work on Window’s computers which have Python 3. installed via the Anaconda distribution and Python 2.7. installed together with the ArcGIS-software. There are different options of how to run Python code. We will start with using Python trough the Spyder IDE while learning the basics of Python. Later in the week we will swhitch to python 2.7. in order to run ArcGIS processes trough Python.
In addition to the different Python-interfaces we will be using,it is also useful to be familiar with basic command line functions in the Windows Command Prompt.
What is an integrated development environment?
An integrated development environment or IDE is a software program or package that provides a set of tools for writing, testing, and debugging software in a convenient, practical interface (often a single window). Often, the components in the IDE include a text editor with options to help debug source code, a built-in terminal or console window, and a pane for viewing variable values, documentation or browsing files on the computer. For us, the main reason for introducing an IDE is that it makes it easier and faster to write and test Python scripts, and common mistakes that can be made when writing code can be indicated in the IDE text editor to help you fix thinks more easily. We will be using the Spyder IDE that is included with Anaconda, but it is just one of many Python IDEs.
Spyder IDE
If you haven’t done so already, open Spyder from All Programs > Anaconda3 > Spyder
Also, for this demonstration we will be using the Python script file Spyder-demo-script.py. Download the file from GitHub to your computer.
An overview of the Spyder IDE

Spyder IDE
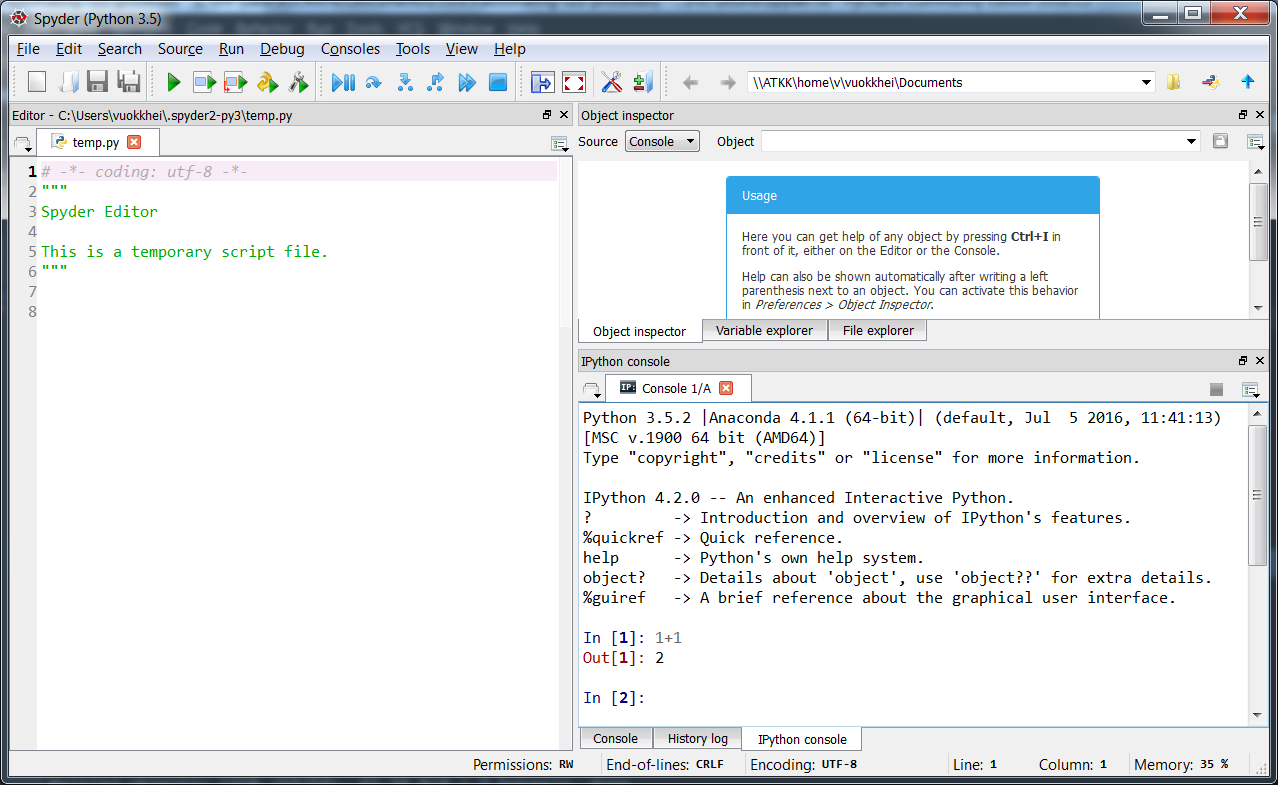
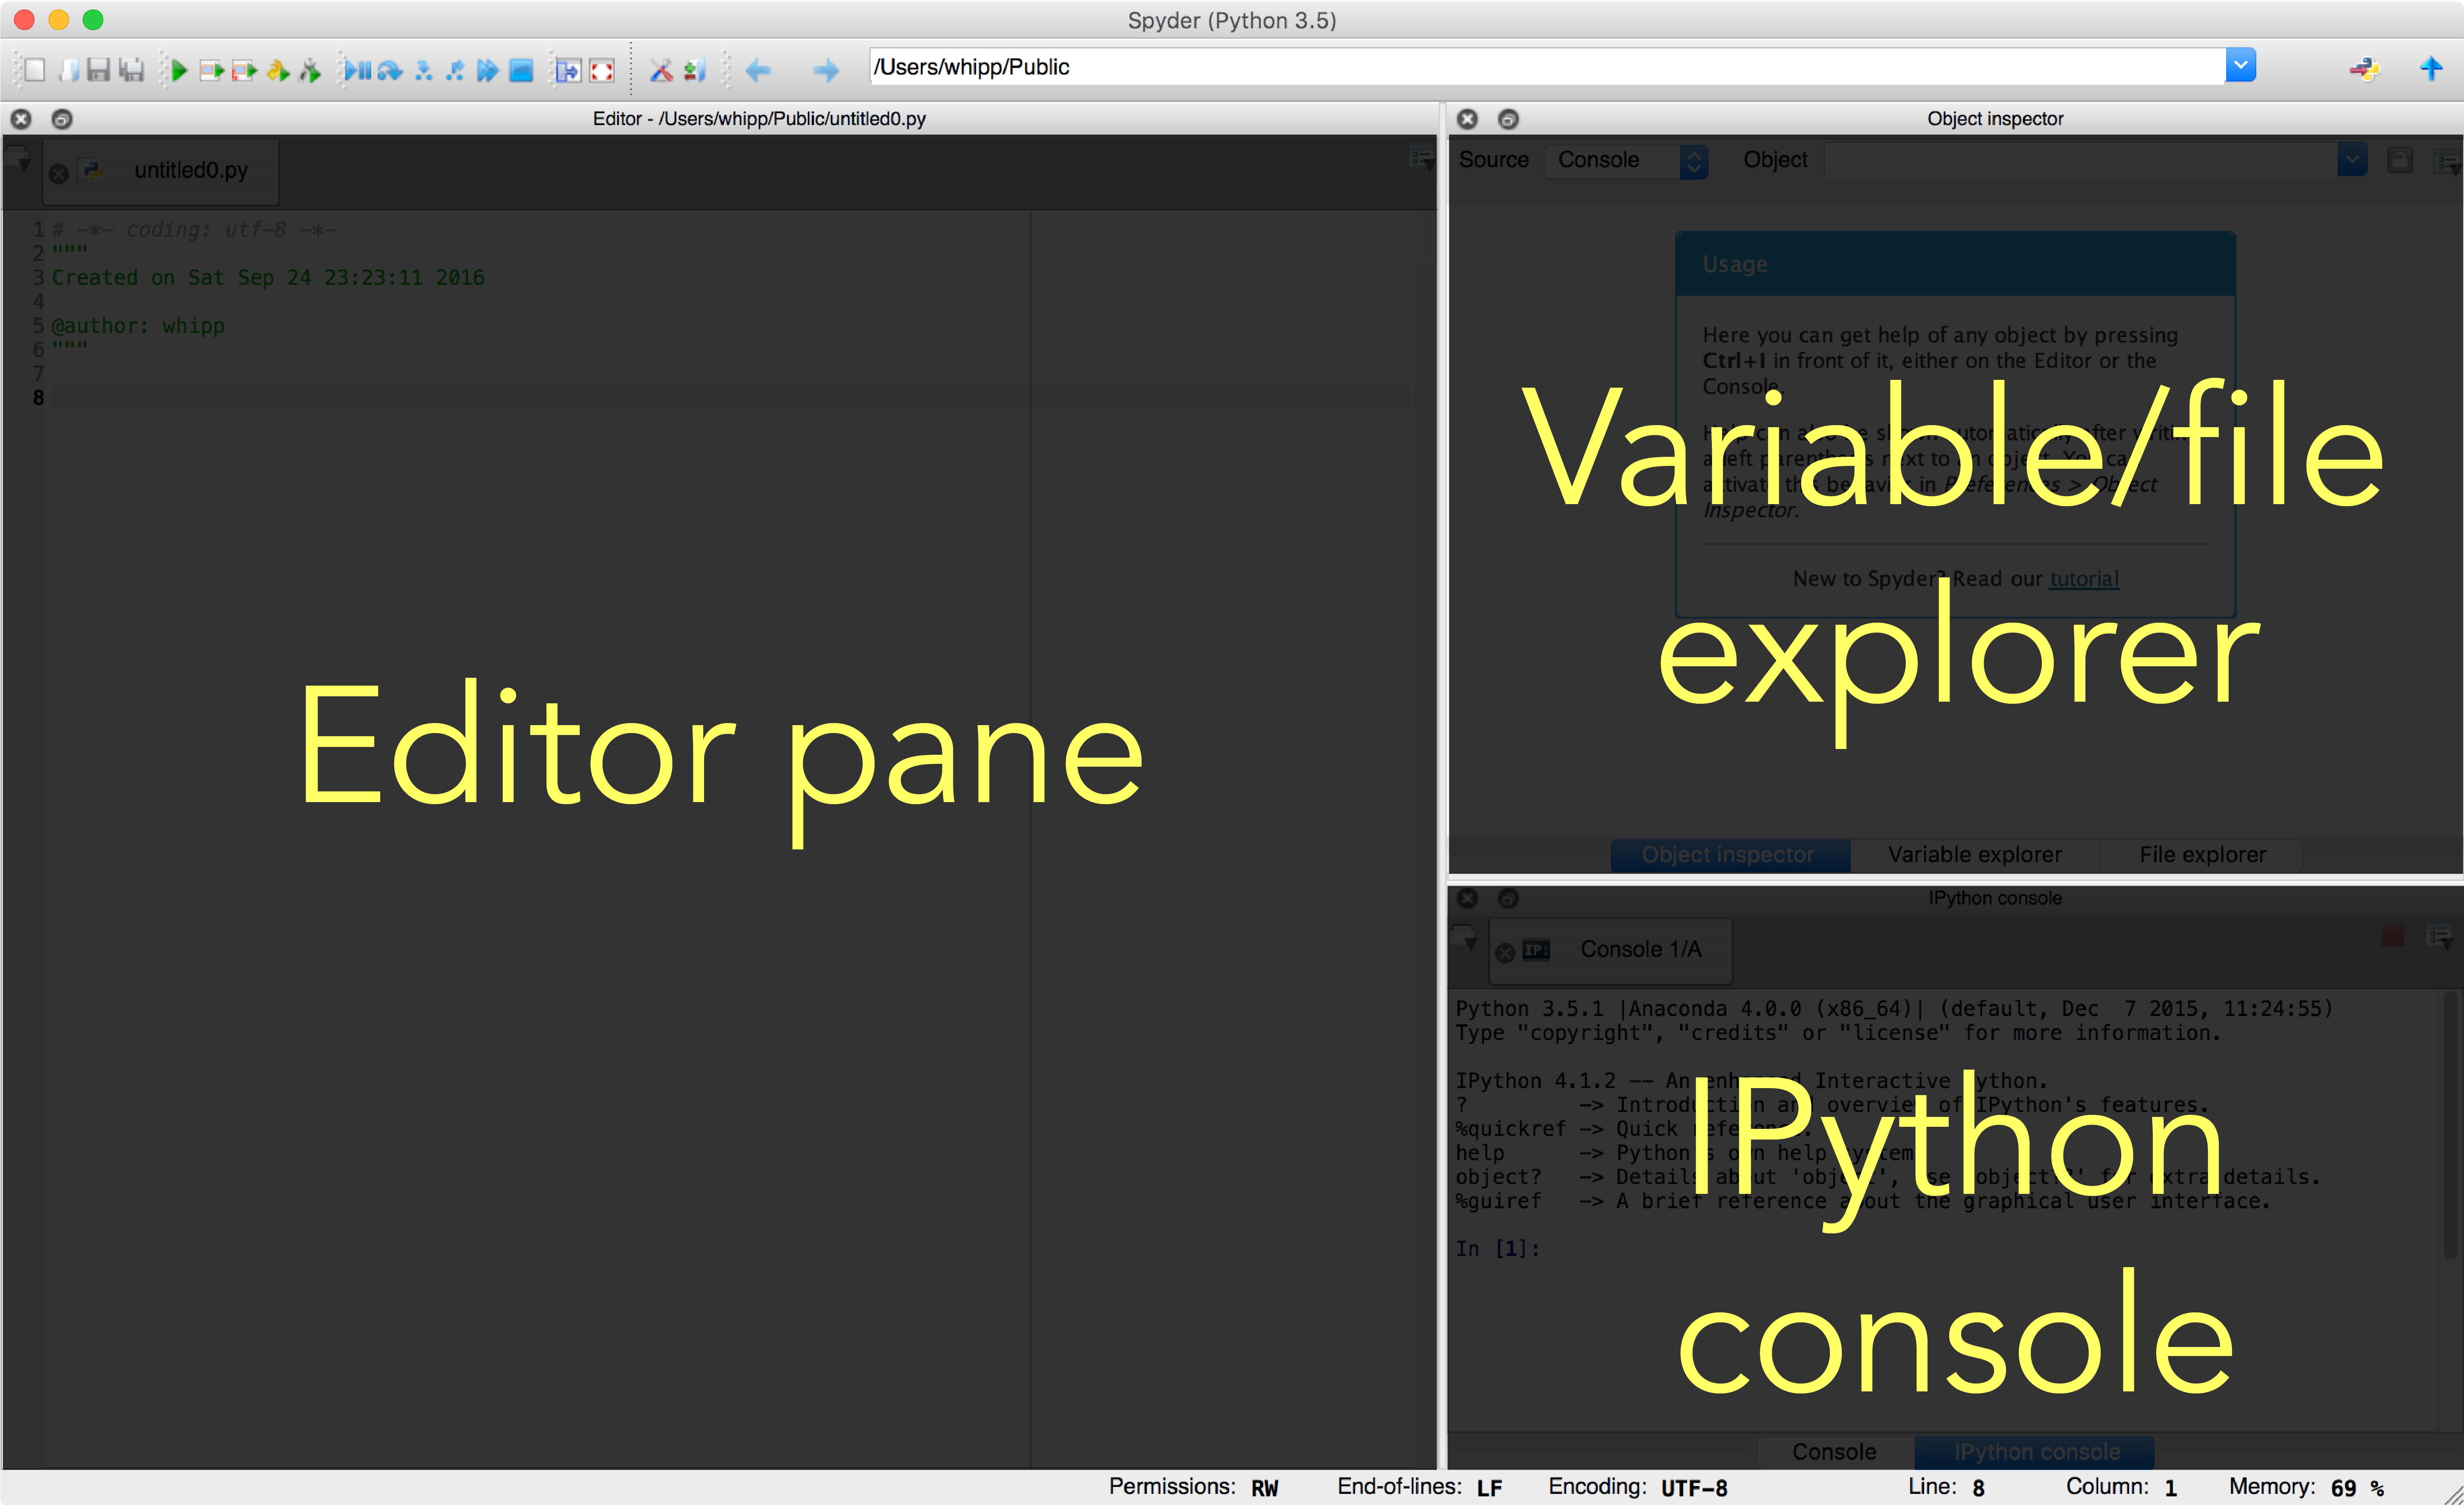
We will be using the Spyder IDE in the basic exercises of this course. As mentioned above, this will allow us to more easily create and edit Python scripts, as well as provide some helpful tools for continuing to learn programming in Python and resolve common code bugs. The Spyder IDE window is broken into several different panes, labeled in the figure below. We will briefly look at each in the following sections.

Panes in the Spyder IDE window
The editor pane
The main pane on the left is the editor pane, used for writing Python scripts. If you have already loaded the Spyder-demo-script.py file, you will see it is basically a normal text editor window with colors used to highlight the text in the script. In addition, you can see line numbers on the left side, which can be helpful when debugging.
There are several features that make the Spyder editor pane more useful than a standard text editor:
- A popup window will appear when you type in functions, providing a
bit of documentation about using them. For example, when you type in
the print statement, a window will pop up after you have typed
print(, showing you how to use the function. - If you have a syntax error on a line of your program, a small yellow triangle or red octagon will be displayed to the left of that line. Hovering over the triangle (or octagon) with your mouse will provide some additional information about the possible cause of the error.
- Within Spyder you can easily run your Python scripts by either clicking on the green play icon in the set of icons at the top of the window, or by going to Run -> Run in the menu bar.
The explorer pane
The explorer pane in Spyder serves three purposes:
- Providing documentation on demand for objects used in your Python
scripts or in the IPython console. The Object inspector tab can
be used to load documentation of various functions or other objects
used either in a script in the editor pane or the IPython console at
the bottom right. Use is simple, just click on the name of a function
in either location and press Ctrl-i to load the documentation. If
you have it loaded you can try this with the
bin()function on line 30 of the Spyder-demo-script.py file, for example. - Listing information about variables in memory. If you have defined
any variables in the IPython console or have run a script in the
editor pane, you can find information about defined variables in
memory listed in the Variable explorer tab. If you run the
Spyder-demo-script.py script,
for example, you will see that the initial value of variable
BigNumberis modified within the script, but kept in the definition of the listOddList. - Allowing you to browse the filesystem within **Spyder**. Lastly, you can browse files on your computer using the File explorer tab. In future lessons and exercises you may find this helpful for locating data files, for example.
The console pane
The console pane is mainly useful because it provides an IPython console for your use. It is a normal IPython console, but note that similar to the editor pane, popup windows will appear when typing in functions to display brief documentation snippets.
The other item that can be displayed in the console pane is your history of commands entered in the IPython console. This is obviously quite helpful if you’re testing things in the IPython console before copying them to a script in the editor pane. You can view the history pane by going to View -> Panes -> History log in the menu bar.
Using the command line
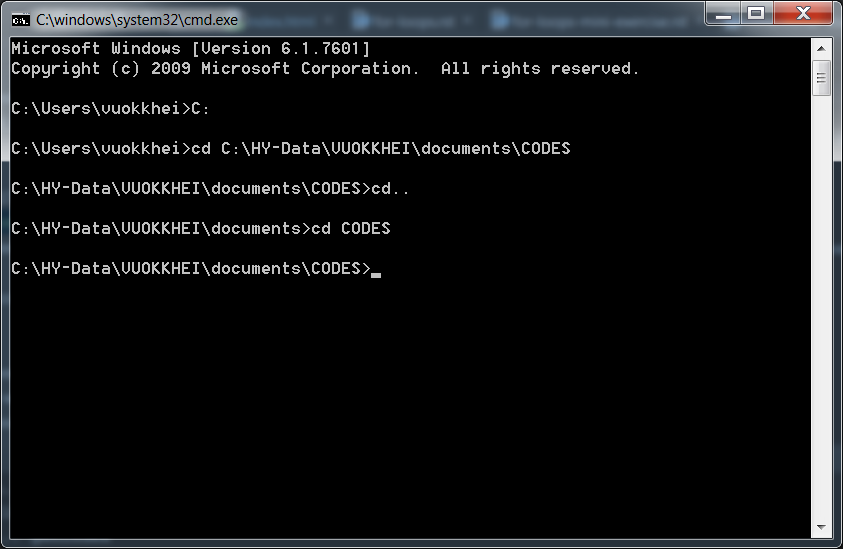
It is good to be familiar with the basics in navigating and using the Disk Operating System (DOS) from a command line. Open command prompt window by typing cmd to Windows search in the start menu.
Here are some quick tips on how to navigate in Windows Command line, which are needed in this course:
| Command | Result |
|---|---|
C: |
Move to C:-drive |
cd folder |
move to folder in current directory |
cd.. |
move to parent directory |
cd C:/temp |
move to directory C:/temp |
dir |
lists contents of the current directory |
Keyboard shortcuts
- Ctrl+C stop ongoing process
- Use up and down arrows for calling previous commands
- Use copy/paste with long file paths!

Windows command line