Lesson 6 Overview
This week we will take a quick tour on how to use Python in ArcGIS using arcpy -module. Exceptionally we won’t be using the computer instance for going through the lesson materials (it is a bit tricky to install on Linux, however, it can be done), instead we will be using the GIS-lab computers where ArcGIS is installed. ArcGIS is not an open source or freely available software such as Quantum GIS or the Python tools that we have been using. However, it is widely used software in many places (companies, public sector etc.) which is the reason why we give this short introduction how you can automatize the ArcGIS workflows using Python scripting with arcpy -module.
Learning objectives
We don’t have any exercise for this week. Thus, the aim this week is to only learn the basics how the ArcGIS tools can be run using arcpy functions, and how we can
create a graphical user interface for your custom scripts using ArcGIS Toolbox (.tbx -file). The aim of this weeks’ lesson is to incrementally create an ArcGIS Python tool that
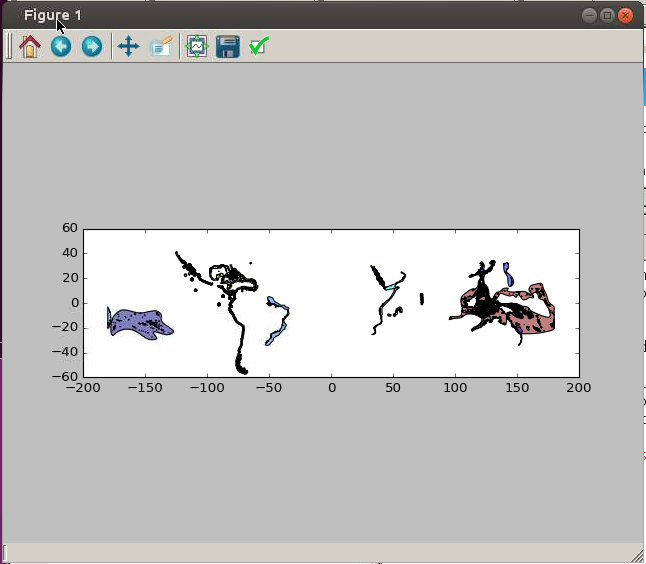
converts the individual Damselfish species distribution Polygons into raster layers (.tif).
After this week’s lesson you should be able to:
- Create a simple user interface using ArcGIS ToolBox.
- Run few different arcpy tools from Python.
- Find and know how to read the arcpy documentation online.
The data we use this week is the same that we used already during the second week: