Raster calculations
Conducting calculations between bands or raster is another common GIS task. Here, we will be calculating NDVI (Normalized difference vegetation index)
based on the Landsat dataset that we have downloaded from Helsinki region. Conducting calculations with rasterio
is fairly straightforward if the extent etc. matches because the values of the rasters are stored as numpy arrays
(similar to the columns stored in Geo/Pandas, i.e. Series).
- Let’s start by importing the necessary modules
rasterioandnumpy
In [1]: import rasterio

In [2]: import numpy as np

In [3]: from rasterio.plot import show
- Let’s read the file that we masked for Helsinki Region
# Filepath
In [4]: fp = r"C:\HY-DATA\HENTENKA\CSC\Data\Helsinki_masked_p188r018_7t20020529_z34__LV-FIN.tif"

In [5]: raster = rasterio.open(fp)
For calculating the NDVI (Normalized difference vegetation index) you need two bands: band-4 which is the Red channel and band-5 which is the Near Infrared (NIR)
- Let’s read those bands from our raster source
In [6]: red = raster.read(4)
In [7]: nir = raster.read(5)
In [8]: red
Out[8]:
array([[0, 0, 0, ..., 0, 0, 0],
[0, 0, 0, ..., 0, 0, 0],
[0, 0, 0, ..., 0, 0, 0],
...,
[0, 0, 0, ..., 0, 0, 0],
[0, 0, 0, ..., 0, 0, 0],
[0, 0, 0, ..., 0, 0, 0]], dtype=uint8)
In [9]: nir
������������������������������������������������������������������������������������������������������������������������������������������������������������������������������������������������������������������������������������Out[9]:
array([[0, 0, 0, ..., 0, 0, 0],
[0, 0, 0, ..., 0, 0, 0],
[0, 0, 0, ..., 0, 0, 0],
...,
[0, 0, 0, ..., 0, 0, 0],
[0, 0, 0, ..., 0, 0, 0],
[0, 0, 0, ..., 0, 0, 0]], dtype=uint8)
In [10]: type(nir)
������������������������������������������������������������������������������������������������������������������������������������������������������������������������������������������������������������������������������������������������������������������������������������������������������������������������������������������������������������������������������������������������������������������������������������������������������������������������Out[10]: numpy.ndarray
In [11]: show(nir)
�����������������������������������������������������������������������������������������������������������������������������������������������������������������������������������������������������������������������������������������������������������������������������������������������������������������������������������������������������������������������������������������������������������������������������������������������������������������������������������������������Out[11]: <matplotlib.axes._subplots.AxesSubplot at 0x20c905720f0>
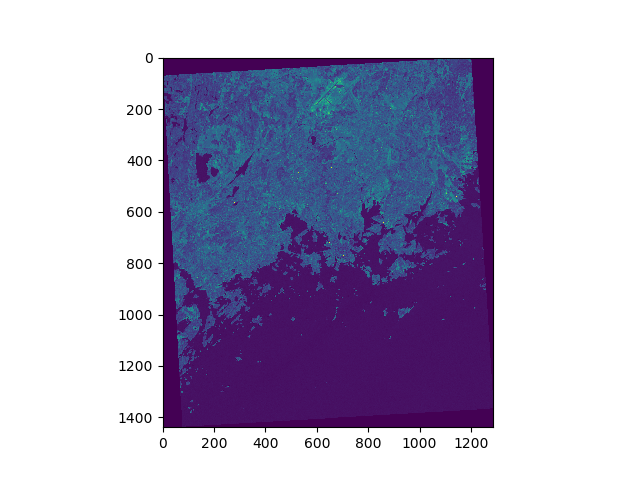
As we can see the values are stored as numpy.ndarray.
- Let’s change the data type from uint8 to float so that we can have floating point numbers stored in our arrays.
In [12]: red = red.astype(float)

In [13]: nir = nir.astype(float)

In [14]: nir
Out[14]:
array([[ 0.,  0.,  0., ...,  0.,  0.,  0.],
       [ 0.,  0.,  0., ...,  0.,  0.,  0.],
       [ 0.,  0.,  0., ...,  0.,  0.,  0.],
       ...,
       [ 0.,  0.,  0., ...,  0.,  0.,  0.],
       [ 0.,  0.,  0., ...,  0.,  0.,  0.],
       [ 0.,  0.,  0., ...,  0.,  0.,  0.]])
Now we can see that the numbers changed to decimal numbers (there is a dot after the zero).
Next we need to tweak the behaviour of numpy a little bit. By default numpy will complain about dividing with zero values. We need to change that behaviour because we have a lot of 0 values in our data.
- Allow 0 division in numpy
In [15]: np.seterr(divide='ignore', invalid='ignore')
Out[15]: {'divide': 'warn', 'invalid': 'warn', 'over': 'warn', 'under': 'ignore'}
Now we need to initialize the ndvi with zeros before we do the calculations (this is numpy specific trick)
In [16]: ndvi = np.empty(raster.shape, dtype=rasterio.float32)
- Now we are ready to calculate the NDVI. First, we can create a filter where we calculate the values on such pixels that have a value larger than 0.
In [17]: check = np.logical_or ( red > 0, nir > 0 )
- Now we can apply that filter and calculate the ndvi index.
In [18]: ndvi = np.where ( check, (nir - red ) / ( nir + red ), -999 )
In [19]: ndvi
Out[19]:
array([[-999., -999., -999., ..., -999., -999., -999.],
[-999., -999., -999., ..., -999., -999., -999.],
[-999., -999., -999., ..., -999., -999., -999.],
...,
[-999., -999., -999., ..., -999., -999., -999.],
[-999., -999., -999., ..., -999., -999., -999.],
[-999., -999., -999., ..., -999., -999., -999.]])
In [20]: ndvi.mean()
������������������������������������������������������������������������������������������������������������������������������������������������������������������������������������������������������������������������������������������������������������������������������������������������������������������������������������������������������������������������Out[20]: -108.16964389074909
In [21]: ndvi.std()
�����������������������������������������������������������������������������������������������������������������������������������������������������������������������������������������������������������������������������������������������������������������������������������������������������������������������������������������������������������������������������������������������������Out[21]: 310.4604815144337
In [22]: show(ndvi, cmap='summer')
��������������������������������������������������������������������������������������������������������������������������������������������������������������������������������������������������������������������������������������������������������������������������������������������������������������������������������������������������������������������������������������������������������������������������������Out[22]: <matplotlib.axes._subplots.AxesSubplot at 0x20c99ecd780>
